Along the top of this application, there are five tabs:
(1) About TAB
Current tab, overview of application and additional information about development.
(2) Templates and User Guide TAB
Here you can access the user guide and templates.
(3) Single Case Use TAB
Here you can enter a single subject's features to analyze the risk score from each MPM.
(4) Local Dataset TAB
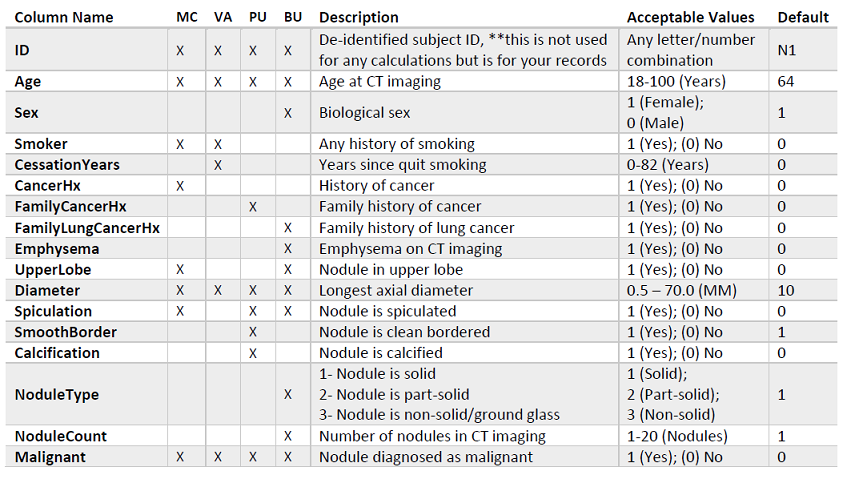
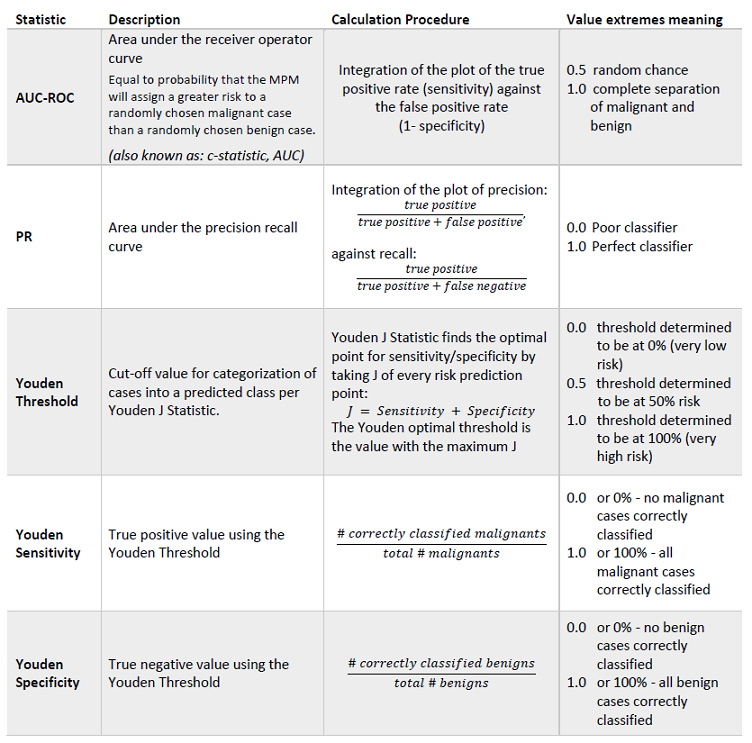
Here you can load your own local cohort for analysis in concordance with the methods described in the publication.
(5) Sample Dataset TAB
Here you can try out the app and explore the environment before you assemble your local dataset.
The sample subjects used are not based on real subject data and should not be used to assess MPM performance or recommend thresholds for real-world cases.
Citing this work
Articles
For more information about post-imaging mathematical prediction models (MPMs) and the methods used here, please see the articles:
K.E. Schroeder, K. Knoernschild, S.L. Averill, R.M. Hoffman, J.C. Sieren,''Comparison of four published cancer prediction equations performance applied to a cohort from the National Lung Screening Trial'' published in Translational Lung Cancer Research. PMID: 41132971
J. Uthoff, N. Koehn, J. Larson, S.K.N. Dilger, E. Hammond, A. Schwartz, B. Mullan, R. Sanchez, R.M. Hoffman, J.C. Sieren, ''Post-imaging Mathematical Prediction Models: Are They Clinically Relevant?'' published in European Radiology. PMID: 30937590
The authors would like to acknowledge Mark Escher and Patrick Thalken for their assistance in application deployment.
Source code
Following publication, the source code for this application will be available on GitLab (https://research-git.uiowa.edu/appil/MPM.git) under Creative Commons Attribution-ShareAlike (CC BY-SA) License. This license lets you remix, tweak, and build upon this work provided you cite the origin code and license new creations under identical terms. This license is similar to copyleft free and open source software licenses.
About Application Development
This application was developed using the R programming language version 3.5.1 (2018-07-02) -- 'Feather Spray'((C) 2018 The R Project for Statistical Computing).
Updates to the application used R version 4.3.0 (2023-04-21) -- 'Already Tomorrow'
R is free software environment for statistical computing and graphics. It complies and runs on a wide variety of UNIX platforms, Windows, and MacOS. It is available under the GNU General Public License. The authors of the associated publication and developers of this application would like to thank the R Development Core Team and all CRAN contributors for their work to make statistical and graphical libraries and tools available to all.
R Core Team (2018). R: A language and environment for statistical computing. R Foundation for Statistical Computing, Vienna, Austria. URL https://www.R-project.org/.
R libraries: 'shiny', 'pROC','PRROC', and 'dplyr'.
Winston Chang, Joe Cheng, JJ Allaire, Yihui Xie and Jonathan McPherson (2018). shiny: Web Application Framework for R. R package version 1.1.0. https://CRAN.R-project.org/package=shiny
Xavier Robin, Natacha Turck, Alexandre Hainard, Natalia Tiberti, Frederique Lisacek, Jean-Charles Sanchez and Markus Muller (2011). pROC: an open-source package for R and S+ to analyze and compare ROC curves. BMC Bioinformatics, 12, p. 77. DOI: 10.1186/1471-2105-12-77 <http://www.biomedcentral.com/1471-2105/12/77/>
Jan Grau, Ivo Grosse, and Jens Keilwagen (2015). PRROC: computing and visualizing precision-recall and receiver operating characteristic curves in R. Bioinformatics (31) 15, pp. 2595-2597.R package version 1.3.1.
Hadley Wickham, Romain Francois, Lionel Henry and Kirill Muller (2018). dplyr: A Grammar of Data Manipulation. R package version 0.7.6. https://CRAN.R-project.org/package=dplyr